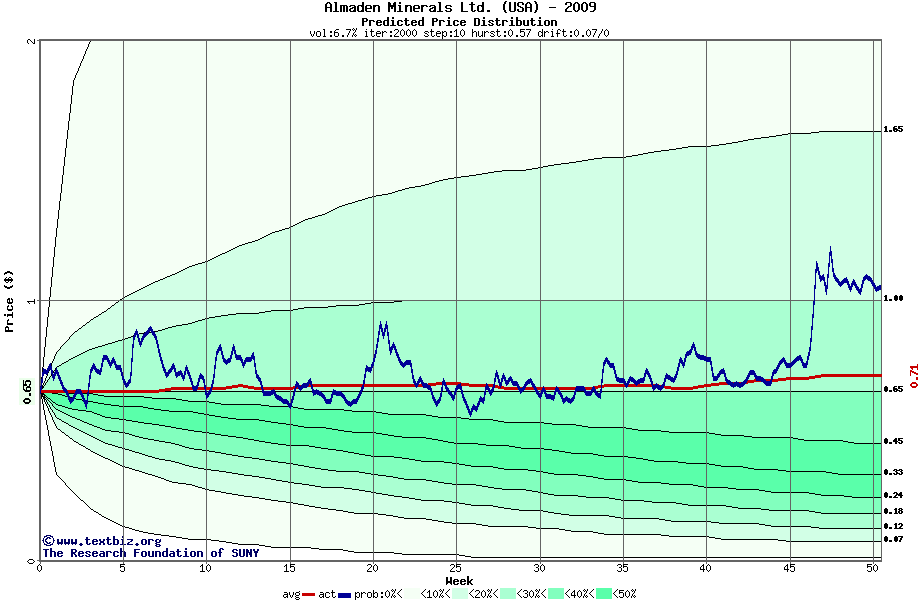
The following graph plots the year-to-date performance of the stock for 2009 compared to the probability calculated by a random walk model.
Initial Value*: $0.7
Hist. Volatility: 6.7%
Annual Drift: 7%
Final Value*: $1.1
Percentile: 81%
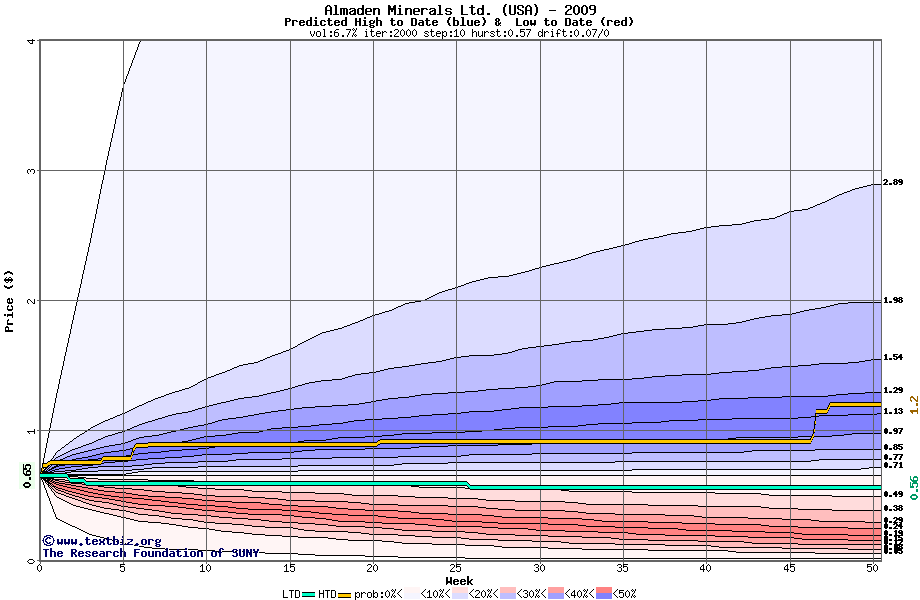
The high to date and low to date prices of the stock plotted against a random walk model for 2009 (what's this?).
© 2005, 2016, The Research Foundation of State University of New York, http://www.textbiz.org