|
 |
SLM Corporation - Medium Term Notes, Series A, CPI-Linked Notes due March 15, 2017 - 2011 (Inactive Symbol) |
YTD Price Probability |
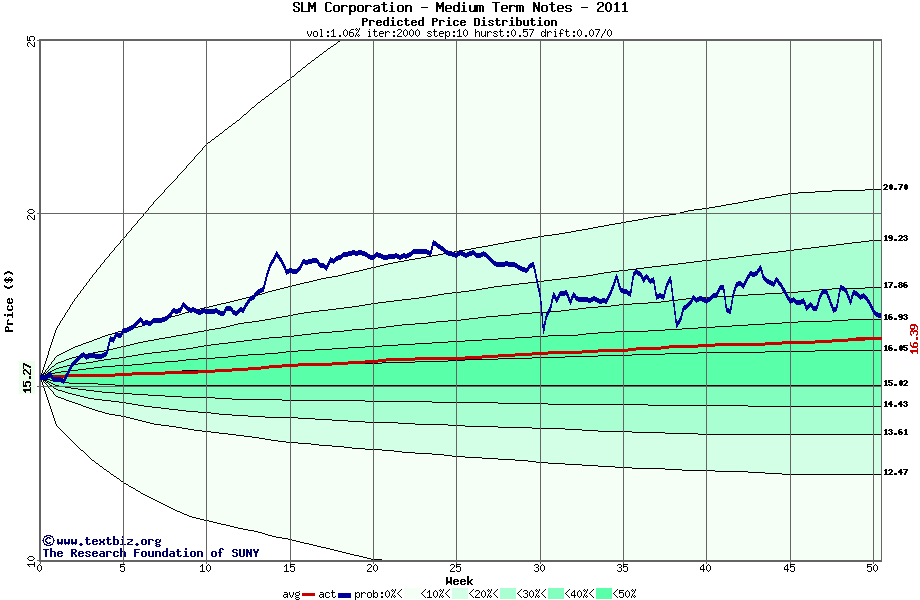
The following graph plots the year-to-date performance of the stock for 2011 compared to the probability calculated by a random walk model.
Initial Value*: $15.3
Hist. Volatility: 1.06%
Annual Drift: 7%
Final Value*: $17.1
Percentile: 61% |
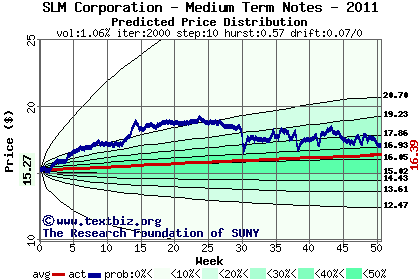 |
| Click on the image for the high resolution version. |
* Stock quotes on TextBiz are always adjusted close prices (what's this?). |
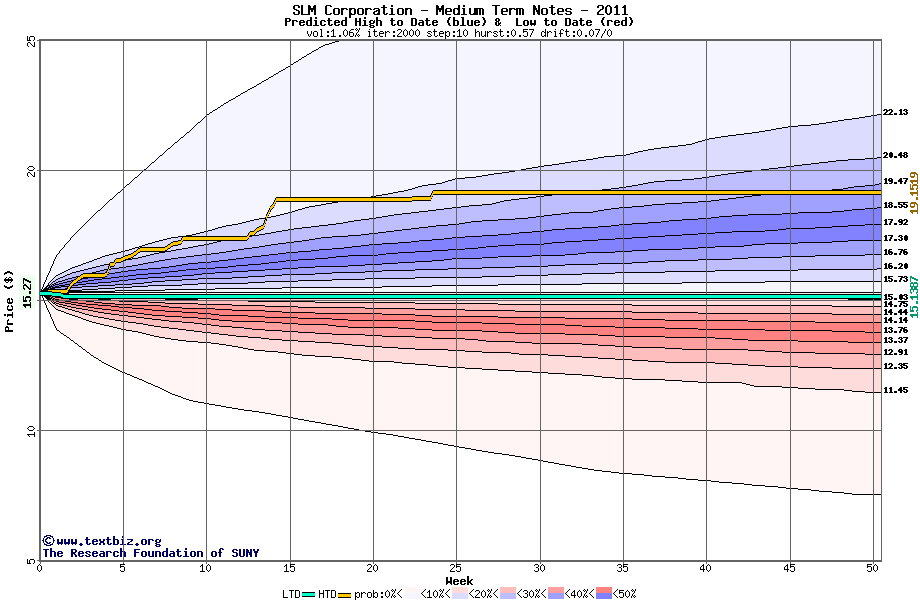
HTD - LTD Price Probability |
The high to date and low to date prices of the stock plotted against a random walk model for 2011 (what's this?).
|
|