Current Profile
 
History
2017
2016
2015
2013
2012
2011
2010
2009
2008
2007
2006
2005
2004
2003
2002
2001
2000
1999
1998
1997
1996
1995
1994
1993

Starbucks Corporation - 2014  (Inactive Symbol)

YTD Price Probability

The following graph plots the year-to-date performance of the stock for 2014 compared to the probability calculated by a random walk model.

Initial Value*: $37.7

Hist. Volatility: 1%

Annual Drift: 7%

Final Value*: $40.1

Percentile: 52%

Predicted price distribution
Click on the image for the high resolution version.
* Stock quotes on TextBiz are always adjusted close prices (what's this?).

HTD - LTD Price Probability

The high to date and low to date prices of the stock plotted against a random walk model for 2014 (what's this?).


Default Prediction for 2014-09-28


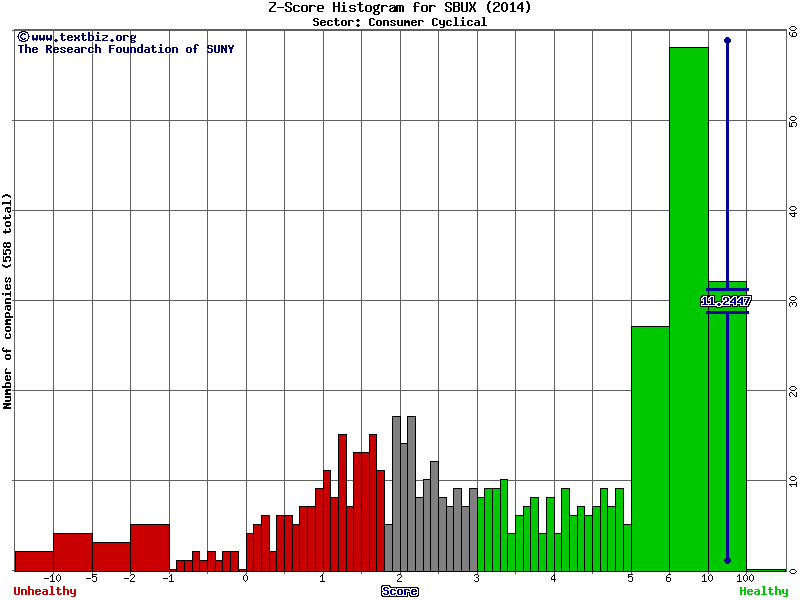
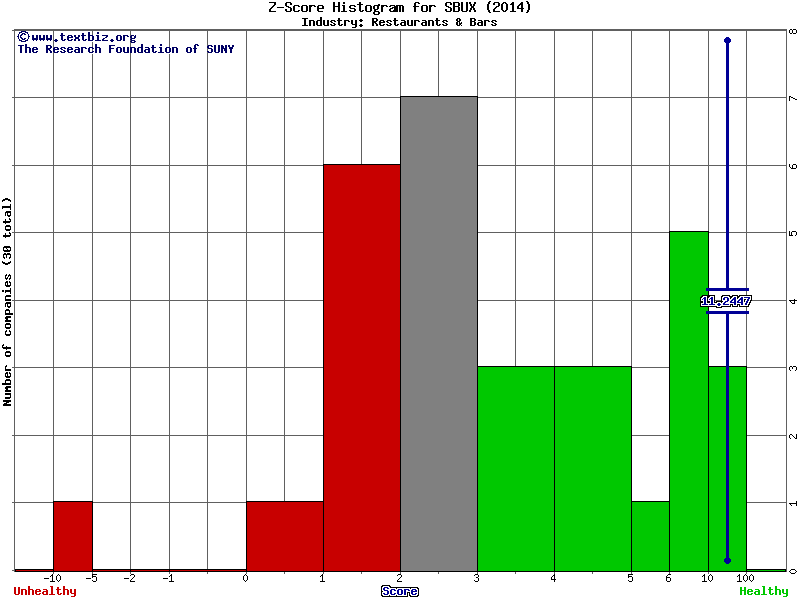
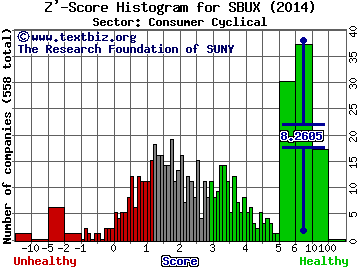
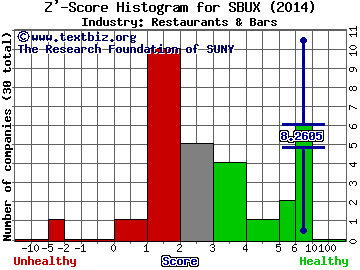
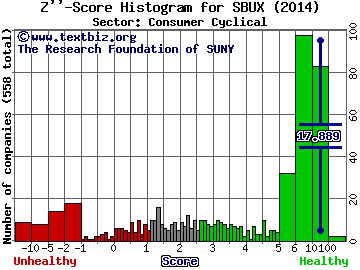
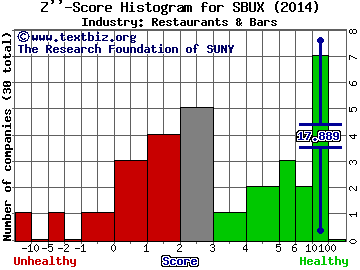
Default prediction by Z-Score (what's this?).

Z Score :  
11.8312   

Sector

Industry

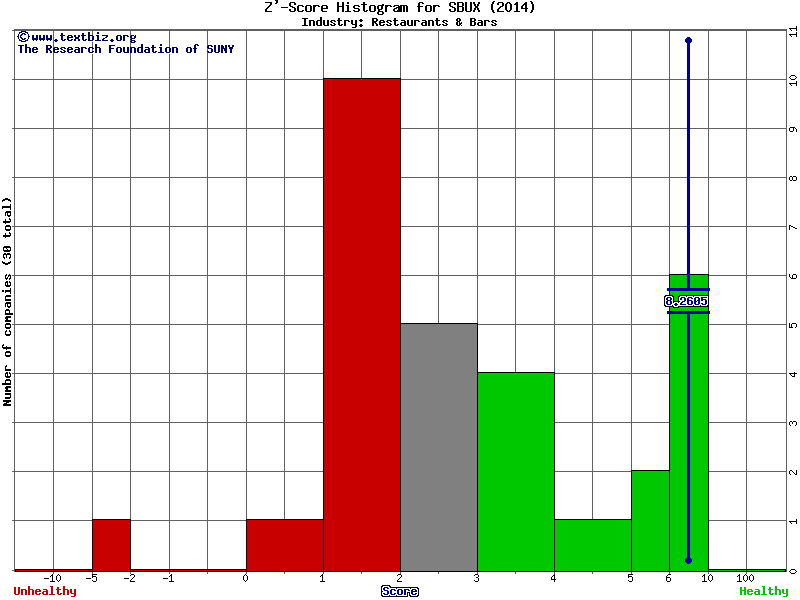
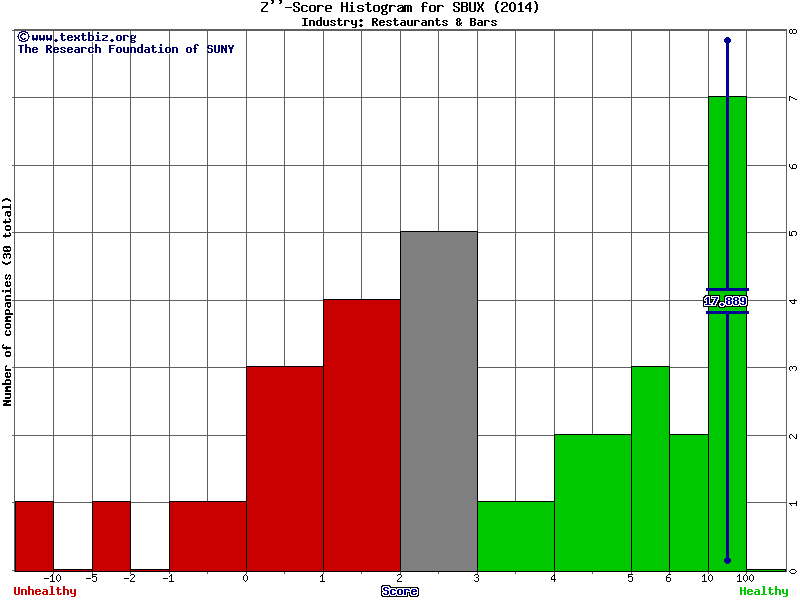
View the other companies in the same industry : Restaurants & Bars

Alternative Z-Scores designed for non-public companies (i.e. take these with a grain of salt):

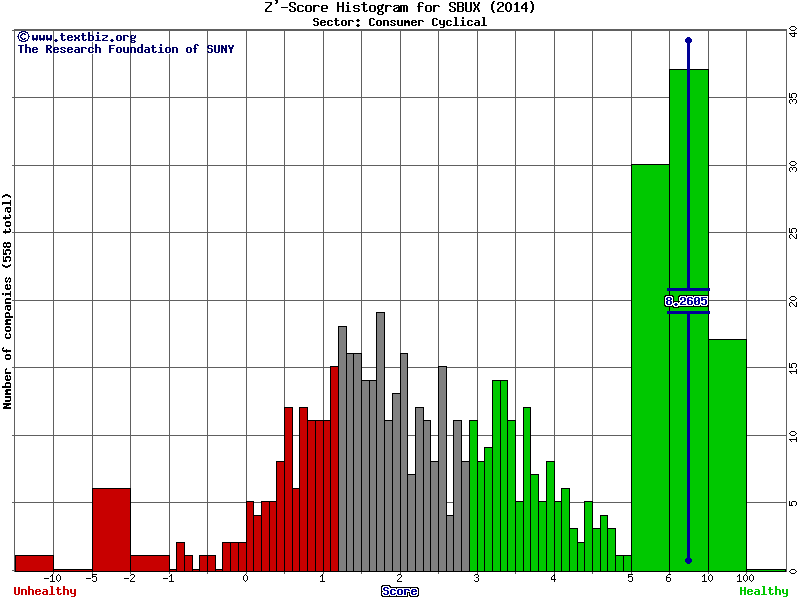
For manufacuring companies:
Z' Score :  
8.671   

Sector         Industry
    

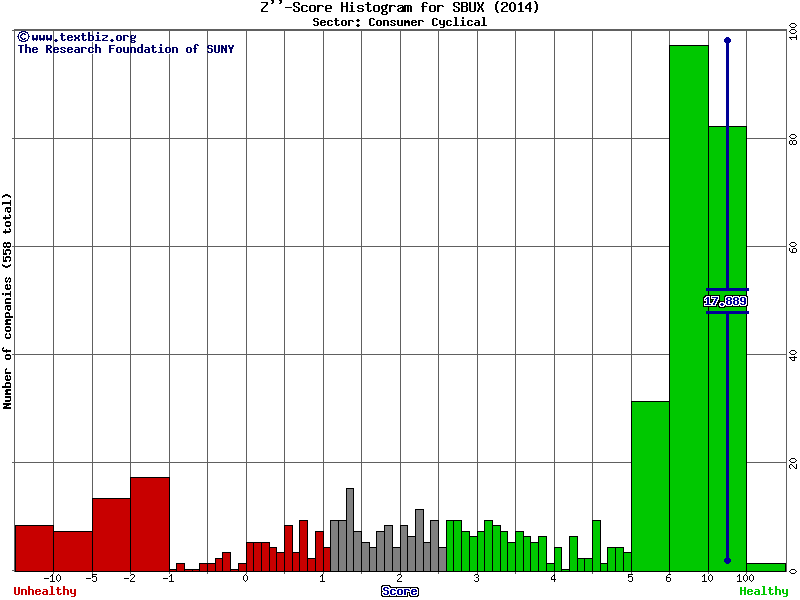
For non-manufacturing companies:
Z'' Score :  
18.9154   

Sector         Industry