Browse the Companies or do a name lookup. Theory behind the site Analysis. Contact us.

Uranium Energy Corp.  

Company profile

Symbol: UEC Exchange: AMEX Sector: Basic Materials Industry: Industrial Metals & Minerals
Market Cap: N/A Data Since: 2008-01-02 Last Close : $2.26 (2008-01-18)
Website: www.uraniumenergy.com
Links: [Web Query]    [News Query]

Analysis :    [Random Walk]   [Default Prediction]   [Fundamental Analysis]


Price Prediction


Random walk modeling for 2008 (what's this?). Click on the images for the high resolution version.

Initial Value* : $3.06 Historic Volatility : 5.15% Annual Drift : 7%

Predicted price distribution   Predicted high to date and low to date price

* Stock quotes on TextBiz are always adjusted close prices (what's this?).


Money Flow Index


Money FLow Index for 2008

Money Flow Index   

* To learn more about Money Flow Index (what's this?).


Default Prediction for 2007-07-31


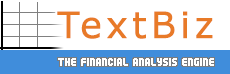
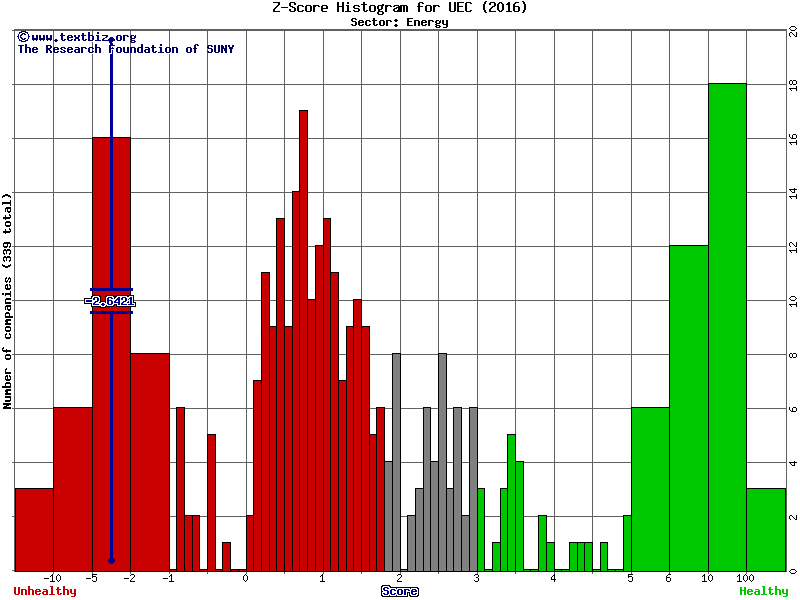
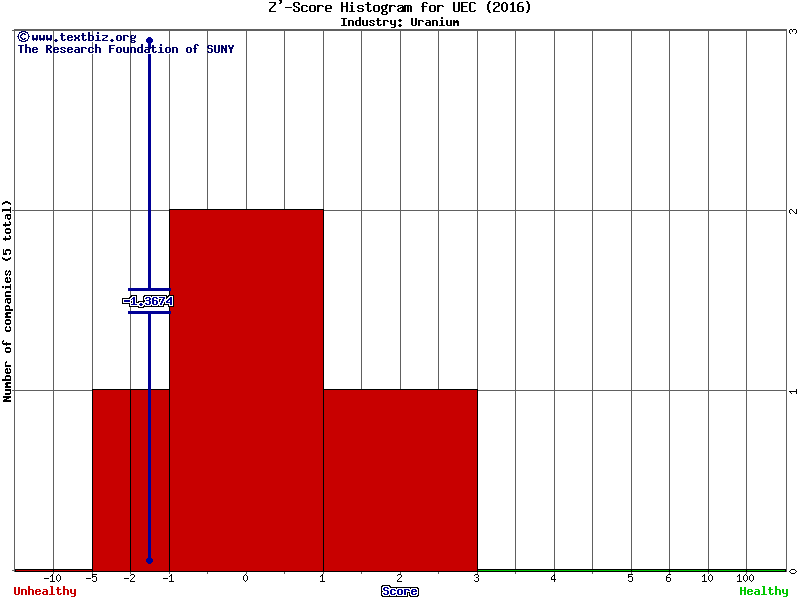
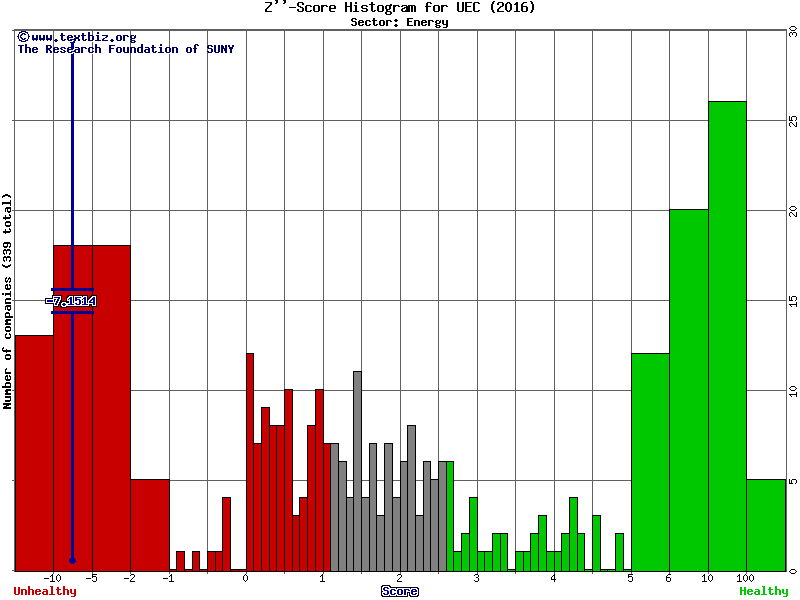
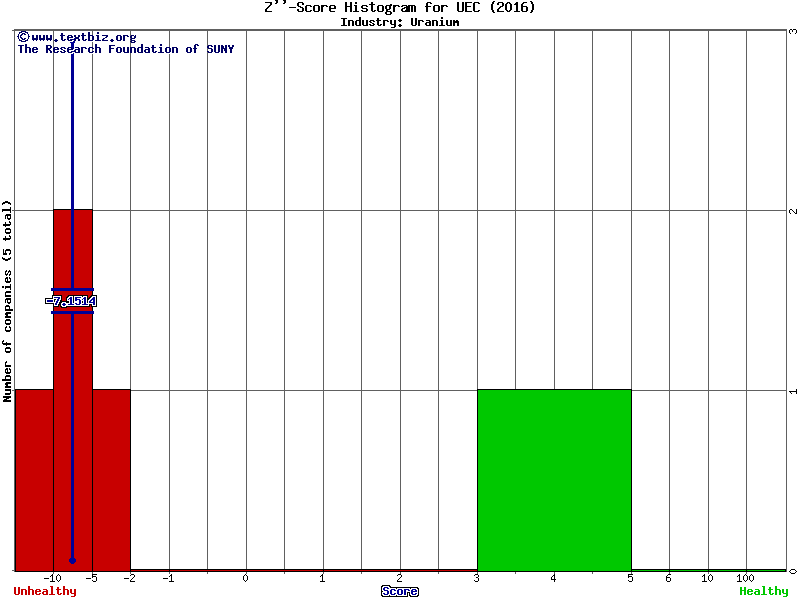
Default prediction by Z-Score (what's this?).

Z Score :  
7.6454   

Sector         Industry
Uranium Energy Corp. Z score histogram (Basic Materials sector)   Uranium Energy Corp. Z score histogram (Industrial Metals & Minerals industry)

View the other companies in the same industry : Industrial Metals & Minerals

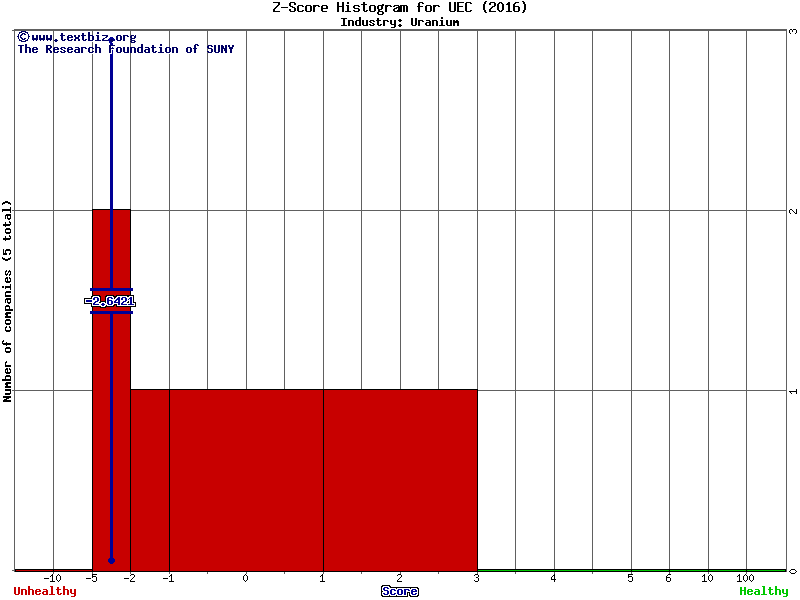
Alternative Z-Scores designed for non-public companies (i.e. take these with a grain of salt):

For manufacuring companies:
Z' Score :  
4.4266   

Sector         Industry
Uranium Energy Corp. Z' score histogram (Basic Materials sector)  Uranium Energy Corp. Z' score histogram (Industrial Metals & Minerals industry)  

For non-manufacturing companies:
Z'' Score :  
13.4317   

Sector         Industry
  Uranium Energy Corp. Z'' score histogram (Basic Materials sector)  Uranium Energy Corp. Z score histogram (Industrial Metals & Minerals industry)


Fundamental Analysis for 2007-


Fundamental Analysis measures (what's this?).

Date of financial statements used:  2007-10-31
Book Value : $5.680 M Internal Value : $5.680 M Working Capital : $4.921 M
Debt to Asset Ratio : 0.085 Current Ratio: 0.097 Turnover Ratio: N/A
Net Margins : -0.000 EPS : N/A P/E ratio : N/A
P/B ratio : -0.000 ROE : -0.854 ROA : -0.782